I am dismayed with the state of dominant desktop web browsers at the moment, by which I mean the big 4: Google Chrome, Microsoft Edge, Mozilla Firefox, and Apple’s Safari.
I don’t know how or why serious people use Safari. It fits into macOS nicely and is scarily energy efficient compared to anything else, but way too many sites don’t work properly with it. It frequently just doesn’t do anything after sticking something in the URL/search bar and hitting enter, and it’s extension story is a joke. I can’t use it at my corporate job because of that last one since extensions can only be installed via Apple’s App Store, and that requires an Apple account.
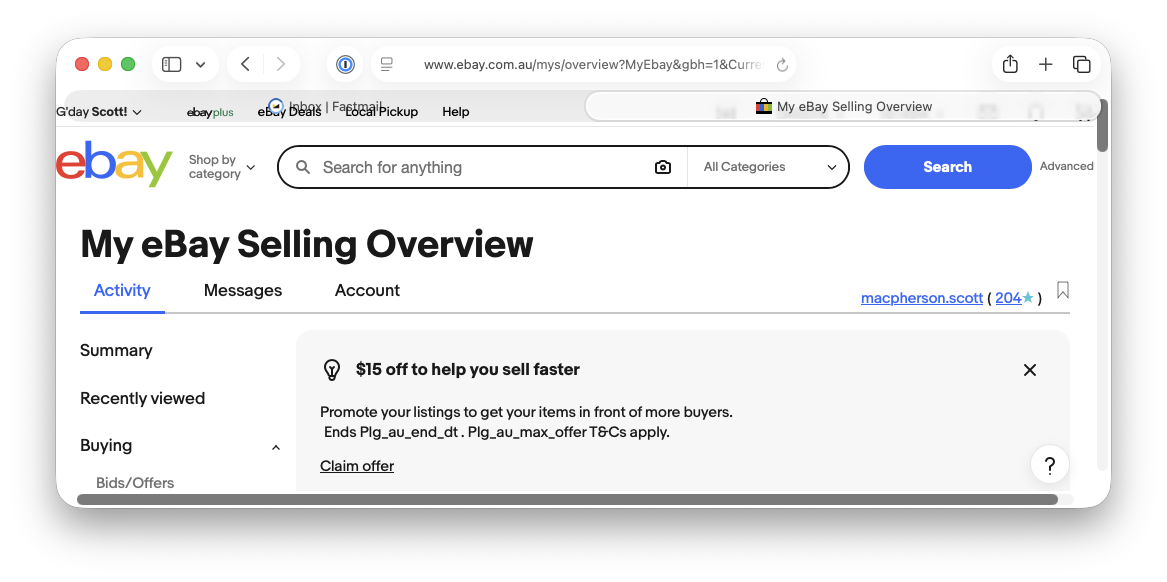
And look at what happened when I gave it a chance yesterday - within minutes it was painting content on top of it’s own tabs:
Google Chrome is a great browser - everything works all the time. Is that because it’s better than everything else, or because it is by far the most used desktop browser? I suspect a bit of both - it certainly got to it’s market position because when it was new it really was so much better than anything else. But the “Google” part just doesn’t sit well with me. They’re an advertising company.
Microsoft Edge is also excellent but let’s face it, it’s Chrome re-skinned and Microsoft are even creepier than Google. And desperate - the last time I looked at Edge it begged me to use Bing and Copilot and some shopping shit and coupon shit and and and. Ew.
And then we get to Firefox. I don’t know how to express my feelings about my beloved Firefox. It just feels like it’s always a few steps behind everyone else. Always playing catch up. Constantly vying for everyone’s attention by trying flashy new things rather than concentrating on stuff that I care about, like bugs that are decades old and still have a status of “new”. There’s just always something about it that’s annoying me at any moment in time.
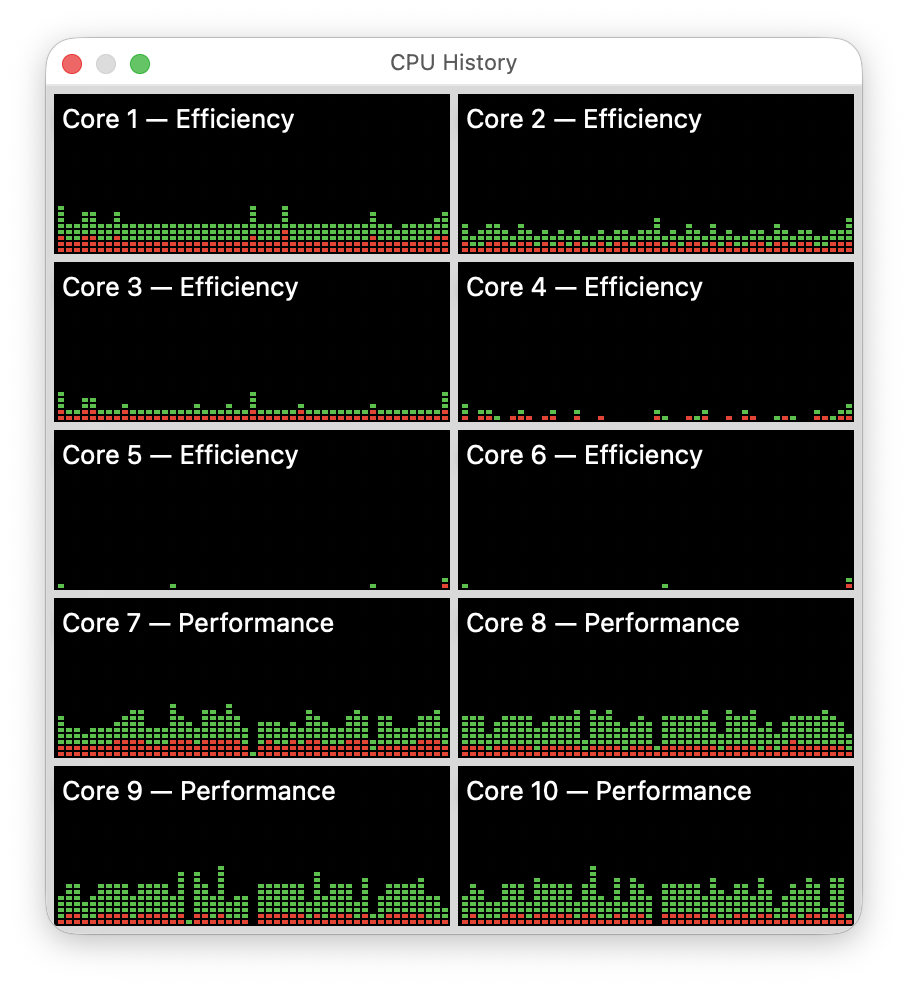
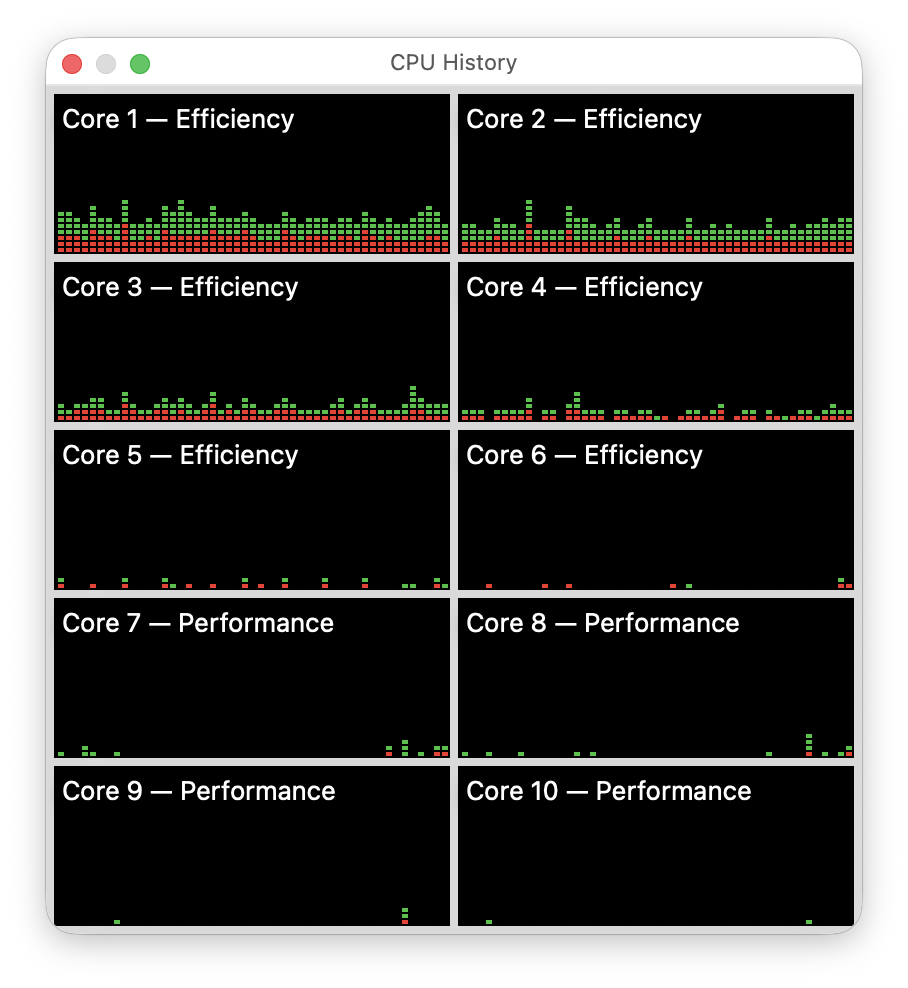
Firefox is also humiliatingly inefficient on Apple silicone, especially when watching full-screen video. As in over 12 hours of battery life when using Safari versus 3 hours when using Firefox. I can’t help them with that.
And look, Mozilla have to make money somehow but I would pay for a version of Firefox that doesn’t come with all the “sponsored” stuff. I’d pay even more if my money bought me one bug fix per year.
I am encouraged by the number of “other” browser projects that are gaining traction, but I need something that gets out of the way and just works. The Opera’s and Orion’s aren’t there yet, for me anyway.